What Is Graph Coloring?
Graph coloring assigns colors to graph elements while avoiding conflicts between connected components. This fundamental concept appears in map design, scheduling systems, and network optimization. The challenge lies in finding the minimum number of colors needed—a problem classified as NP-hard in computational theory.
Types of Graph Coloring
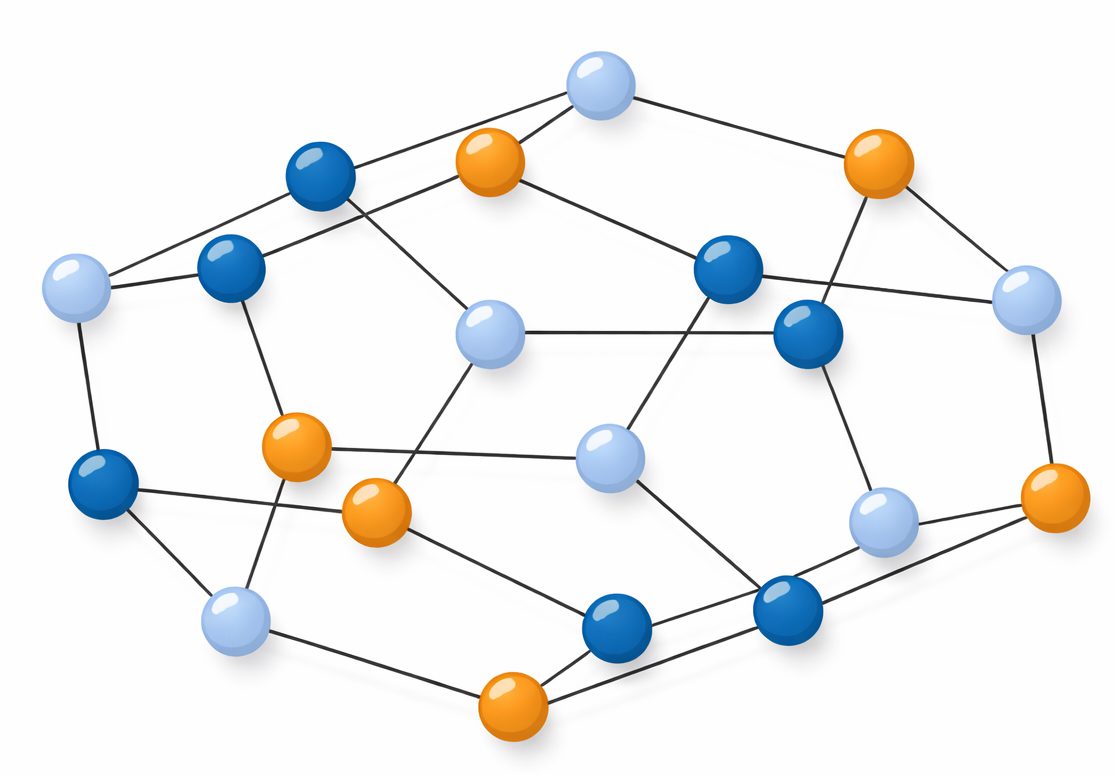
Node Coloring
The most common form involves coloring vertices so no adjacent nodes share the same color. This technique underpins many real-world applications like classroom scheduling and register allocation in compilers.
Edge Coloring
Edge coloring ensures no two edges meeting at a node share the same color. Konig’s theorem proves that bipartite graphs require exactly Δ(G) colors, while Vizing’s theorem shows all graphs need at most Δ(G)+1 colors.
Face Coloring
Planar graphs require face coloring to ensure adjacent regions have different colors. The famous four-color theorem guarantees that any map can be colored with just four colors—a discovery first proposed in 1852.
Practical Applications
- Sports Scheduling: Edge coloring creates balanced league calendars
- Map Design: Face coloring optimizes geographic visualization
- Network Routing: Node coloring prevents signal interference
Visualization Tools
The open-source GCol library provides Python implementations for all three coloring types. It combines exact algorithms with heuristic approaches to generate optimal solutions.
Key Theoretical Concepts
Understanding these principles helps solve complex problems:
- Line graphs convert edge coloring to node coloring
- Dual graphs transform face coloring into node coloring
- Force-directed layouts improve visualization clarity
Conclusion
Graph coloring bridges abstract mathematics with practical applications. Whether optimizing timetables or designing maps, these techniques offer powerful solutions. Start experimenting with the GCol library to see how these concepts work in practice.