
Why Fourier Transform Matters in Sound Analysis
Imagine listening to a symphony where every instrument blends into a single, chaotic wave. How do we separate the violin’s melody from the cello’s rhythm? The answer lies in the Fourier Transform, a mathematical tool that deciphers hidden frequencies in sound. This article explains its intuition without diving into complex equations.
Digital Sound: From Waves to Numbers
Before Fourier Transform, we need to grasp how sound becomes digital. Real-world sound is a continuous wave of air pressure. Computers store it as discrete numbers through two steps:
- Sampling: Taking snapshots of the wave’s amplitude at regular intervals (e.g., 44,100 times per second for CD-quality audio).
- Quantization: Assigning each snapshot a value from a finite range (e.g., 65,536 levels for 16-bit audio).
This creates a time-domain signal—a list of amplitudes over time. The Fourier Transform takes this list and reveals the frequencies that built it.
Fourier Transform: The Color Mixing Analogy
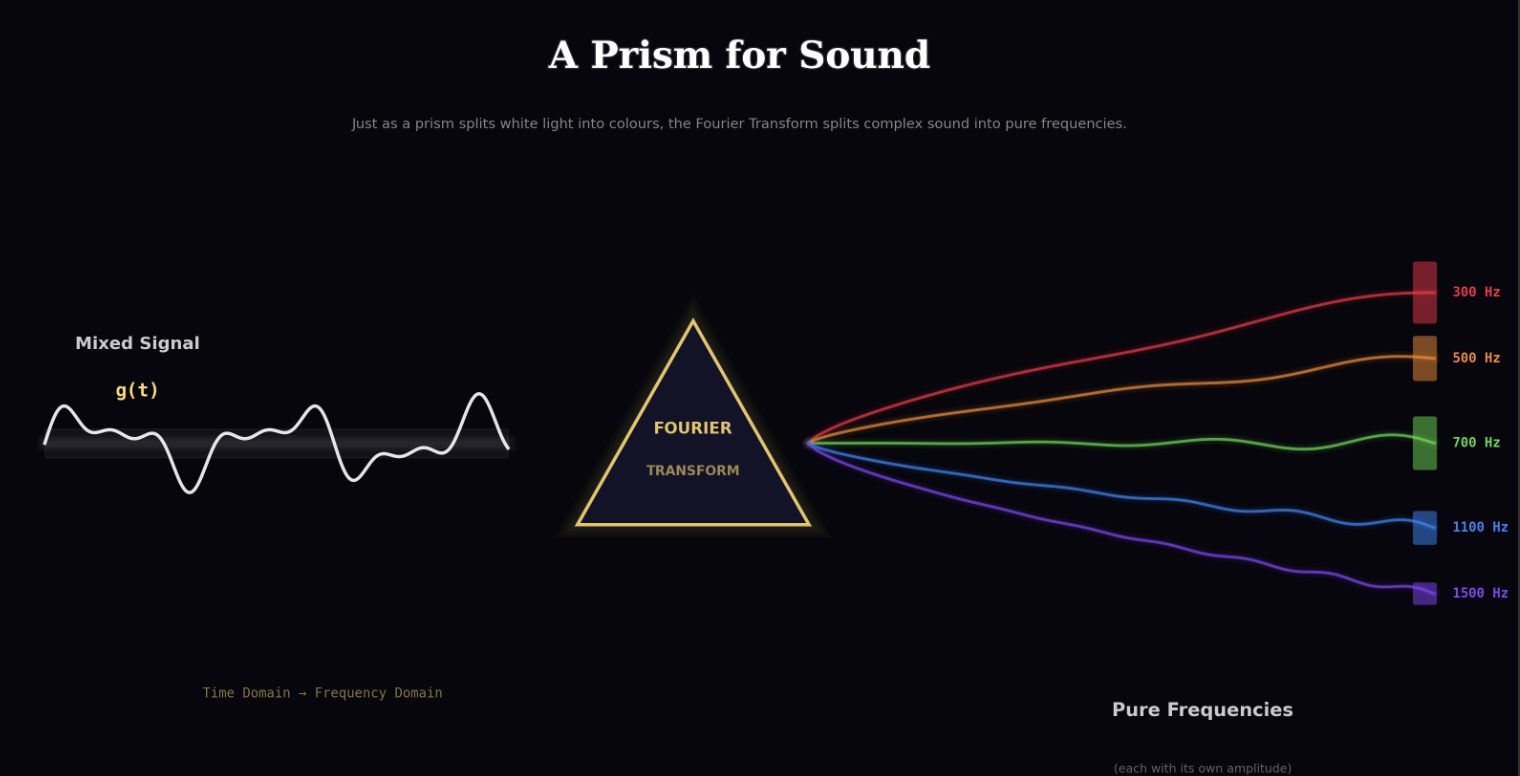
Think of a sound wave as a bucket of mixed paint. The Fourier Transform separates it into individual colors (frequencies). Here’s how it works:
- Input: A time-domain signal (amplitude vs. time).
- Process: The Transform evaluates how much each frequency contributes to the signal.
- Output: A frequency-domain graph showing peaks at dominant frequencies.
For example, a voice recording might show peaks at 300 Hz and 700 Hz, revealing its core frequencies.
The “Winding Machine”: How Fourier Transform Works
At its core, the Fourier Transform uses a clever trick: wrapping the signal around a circle in the complex plane. Here’s the intuition:
- Step 1: Multiply the signal by a rotating vector (e−2πift) at a specific frequency f.
- Step 2: The result is a complex number with two parts: magnitude (amplitude of f) and phase (starting point of f).
Repeating this for all frequencies creates a map of contributions. High magnitudes mean strong frequency presence; low magnitudes mean weak or absent frequencies.
Practical Applications in Machine Learning
Libraries like librosa.stft() and np.fft.rfft() use Fourier Transform to convert audio into spectrograms. These visualizations help train models to recognize speech, music, or environmental sounds. For instance, 16 kHz sampling is sufficient for speech analysis, capturing all relevant frequencies without unnecessary data.
Why This Matters
Understanding Fourier Transform intuition empowers you to:
- Debug audio preprocessing pipelines.
- Optimize models for specific frequency ranges.
- Interpret spectrograms effectively.
Whether you’re analyzing music or building voice assistants, this tool is your gateway to the frequency domain.
Take the Next Step
Ready to dive deeper? Experiment with Python’s numpy.fft to visualize frequency peaks in your own audio files. The more you apply it, the clearer the intuition becomes.